I Built a Website That Explains—and Tracks—the AI Arms Race
OMIKINA is a public atlas for understanding the physical systems beneath American artificial intelligence.
By John N. Farmer
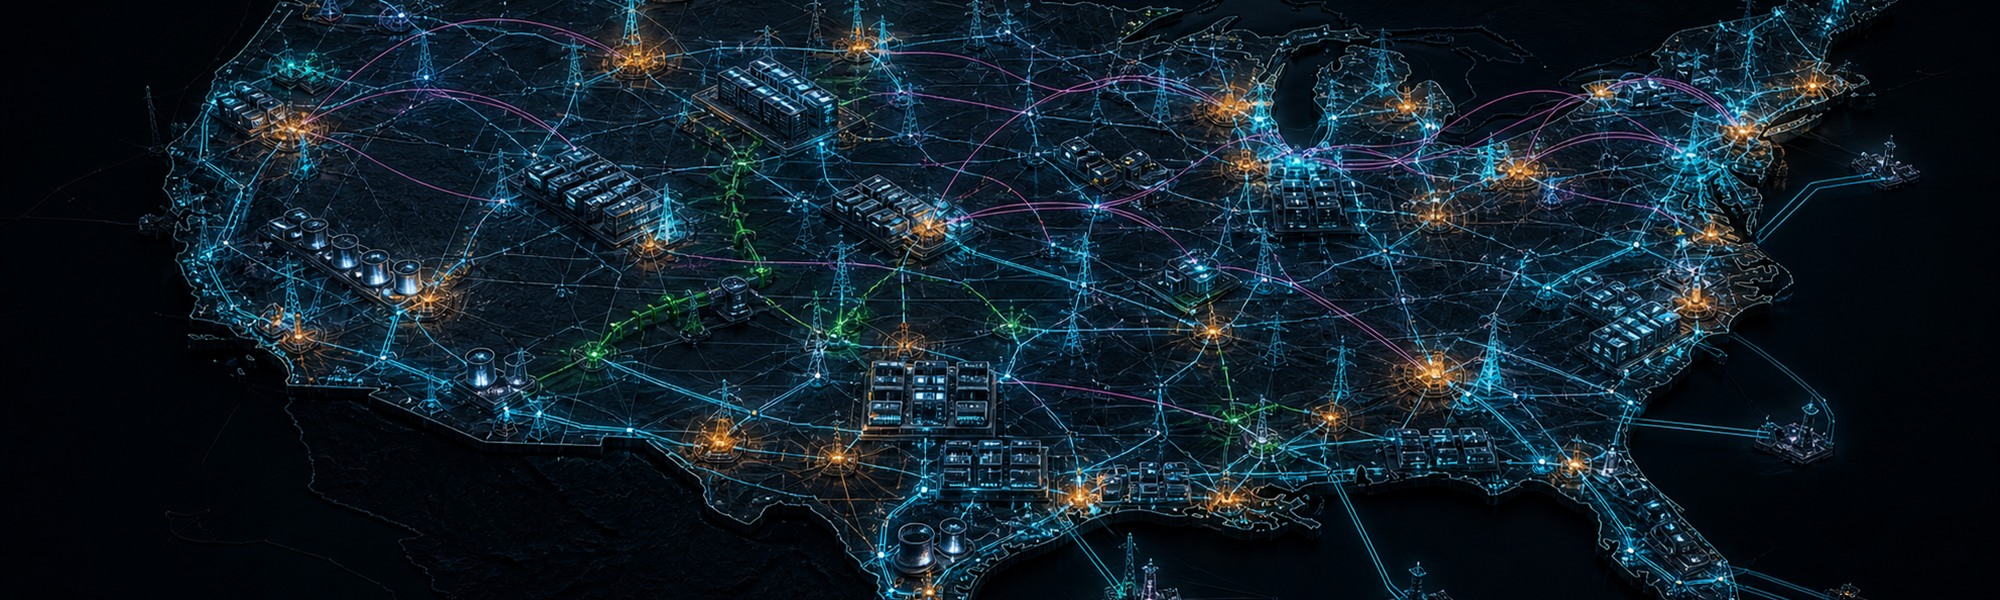
The AI race is usually told as a contest between models: more intelligence, more speed, more users, more capital.
But no model runs in the abstract.
Every prompt eventually reaches a physical machine inside a real building. That machine needs chips, cooling, electricity, grid capacity, land, equipment, workers, financing, and public permission. Some power strategies also depend on nuclear reactors and specialized fuel. The “cloud” is not weightless. It is one of the largest and fastest-moving industrial systems now being assembled in the United States.
That is why I built OMIKINA: a public atlas for understanding the physical systems beneath American AI.
The cloud is a supply chain
The phrase “AI arms race” gets attention because the competitive pressure is real. Companies and governments are moving quickly to secure compute, energy, sites, equipment, and strategic advantage.
But the most important part of that race is often hidden behind product announcements and benchmark scores.
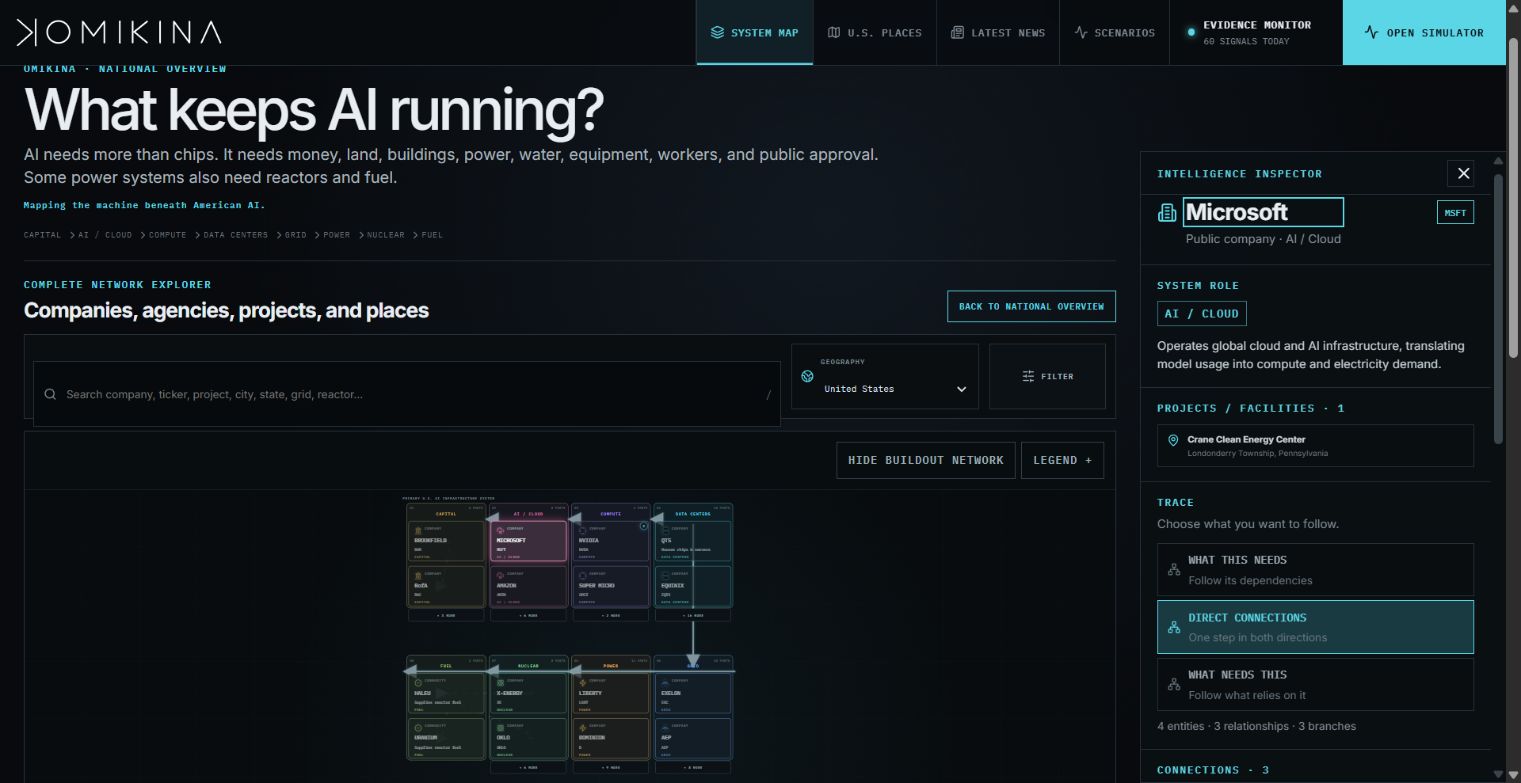
OMIKINA begins with a simple question: What keeps AI running?
Its national overview follows the dependency chain from capital to AI and cloud platforms, compute, data centers, the grid, power generation, nuclear systems, and fuel. A supporting buildout network adds the systems that determine whether projects can actually move: land, water, cooling, interconnection, construction, transformers and other equipment, workforce capacity, communities, policy, and permitting.
This structure changes the question. Instead of asking only which model is ahead, we can ask:
- Where will the next large block of power come from?
- Which projects are operating, under construction, or still proposed?
- Which grid regions are absorbing the most pressure?
- Which supply chains could become bottlenecks?
- Which communities and public agencies determine whether a project proceeds?
Those are not secondary questions. They are the operating conditions of the AI economy.
Geography is strategy
Infrastructure becomes easier to understand when it is placed on a map.
OMIKINA’s U.S. Places view connects selected, sourced infrastructure locations to the wider system. Marker shapes distinguish operating facilities, construction sites, proposed projects, government locations, regional clusters, and OMIKINA editorial regions. Search and geographic filters make it possible to move from a national view toward a particular state, project, company, grid, reactor, or city.
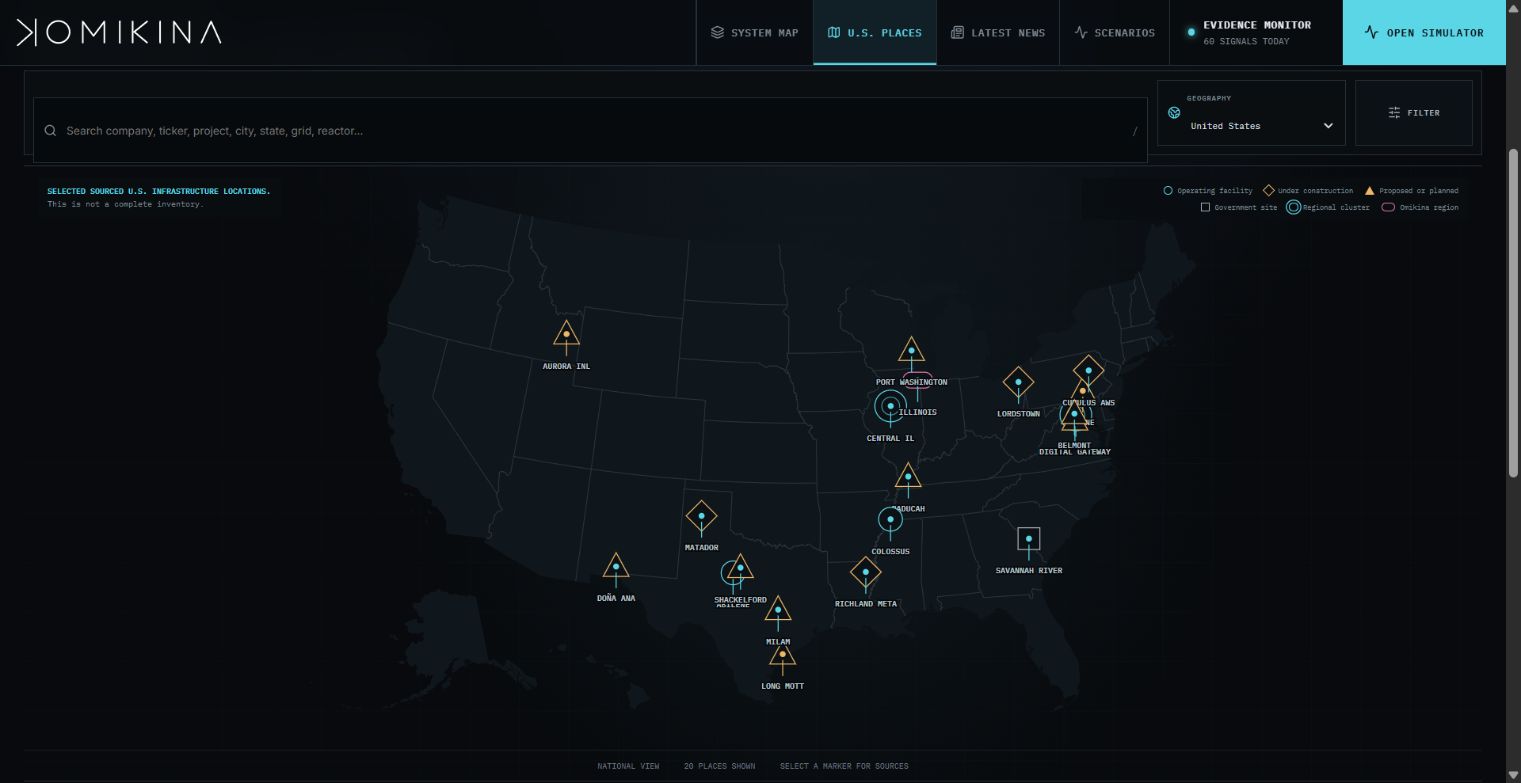
The map is intentionally transparent about its limits. It shows selected sourced locations—not every facility in America. That distinction matters. A polished visualization can create a false sense of completeness, so OMIKINA states what the map contains and what it does not.
Over time, the geographic layer can make several important patterns easier to see: the concentration of data-center demand, proximity to generation and transmission, regional competition for land and water, the reuse of retired industrial or energy sites, and the growing role of local approval.
Tracking change without confusing signals with facts
The infrastructure race changes daily, but a news headline is not the same thing as a verified relationship.
OMIKINA separates those layers.
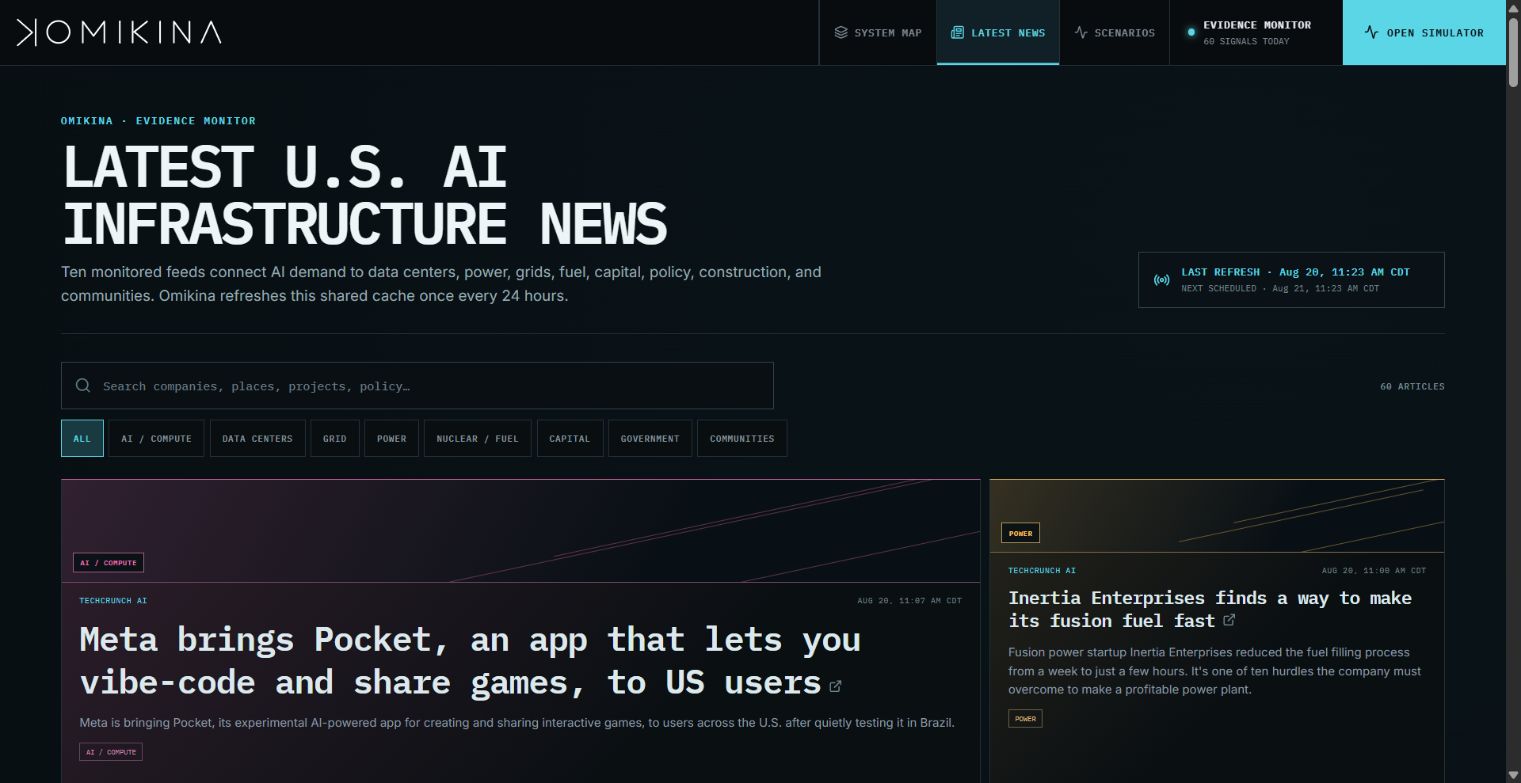
Its evidence monitor follows reporting across AI, data centers, power, grid operations, fuel, capital, government, and communities. The latest-news view organizes current reporting by system category and refreshes a shared cache on a daily schedule.
Daily signals do not silently rewrite the map. A relationship is published with an explicit status:
- Sourced — supported by external documentation.
- Company-reported — based on a company’s own statement or filing.
- Inferred — a reasoned connection that is clearly labeled as interpretation.
- Illustrative — used in an educational scenario, not presented as a forecast.
That separation is central to the project. AI infrastructure is full of announcements, ambitions, memoranda, proposed campuses, projected power needs, and shifting timelines. A useful atlas has to preserve uncertainty instead of polishing it away.
Built for orientation first, evidence second
OMIKINA is designed around two levels of understanding.
The first is a guided national story: a plain-language view of the physical chain beneath AI. The second is a complete network explorer containing the companies, agencies, projects, places, commodities, resources, and relationships behind that overview.
Select any entity and the atlas can trace:
- what it needs;
- what depends on it;
- direct connections in both directions;
- associated projects and geographic records;
- evidence status and source links; and
- current reporting that may deserve review.
The directional rule is simple: arrows point toward what each part needs.
That makes the atlas useful to more than one audience. Executives can see constraints beyond compute. Policymakers can see where industrial strategy meets permitting and grid reality. Communities can see how a local project fits into a national buildout. Researchers and investors can trace claims back to their evidence instead of treating every announcement as settled fact.
Why launch it now
The next chapter of AI will not be determined by models alone.
It will be shaped by how quickly the United States can build generation, expand transmission, manufacture equipment, secure fuel, develop sites, train workers, finance projects, and earn public trust. In many regions, those physical constraints may move more slowly than software.
OMIKINA is my attempt to make that system legible while it is still being built.
This is an evolving public atlas, not a finished inventory and not investment advice. The goal is to create a clearer shared picture: what exists, what is proposed, what depends on what, where the evidence is strong, and where uncertainty remains.
Explore OMIKINA.com. Follow a dependency. Open a place. Check a source. Then tell me what project, relationship, public decision, or piece of evidence should be added next.
Because if AI is becoming national infrastructure, we should be able to see the machine we are building.